

See Your Data. Own Your Decisions.
Dashboard Updated
Real-time data refreshed
Sound familiar?
"I spend 4 hours every week building reports in Excel"
"What's our MTTR? I honestly have no idea"
"Leadership keeps asking for numbers I can't provide"
"I can't prove my team's value at budget time"
With Infodeck
Custom dashboards with drag-and-drop widget builder
Multiple widget types including KPI cards and line charts
Monitor dashboards with auto-refresh for live data
Report dashboards with selectable time ranges
Why Analytics Matters
Infodeck dashboards give you the visibility you need. Here's what the platform offers.
Data-driven decisions
From spreadsheets to real-time dashboards
Weekly report time
Weekly report time
98% fasterReal-time visibility
Real-time visibility
Live dataKPIs tracked
KPIs tracked
Full coverageDecision lag
Decision lag
Instant insight30-minute demo • Pricing by operating scale
Dashboards that show what matters
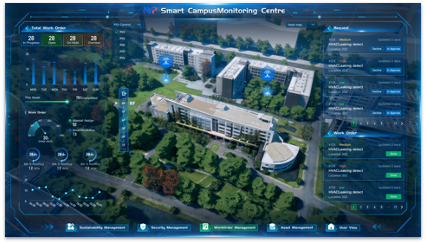
Build custom dashboards with multiple widget types. Visualize sensor data, track work orders, and monitor operations in real-time.
Scheduled Delivery
Set it and forget it. Weekly summaries land in stakeholder inboxes every Monday morning.
Executive Dashboards
High-level views that tell the story. Perfect for board meetings and leadership reviews.
Compliance Reports
Audit-ready documentation generated automatically. Pass inspections with confidence.
Cost Breakdown
See exactly where maintenance dollars go. By asset, location, category, or vendor.
Everything you need to prove value
Built-in reports that answer leadership's toughest questions
Real-time KPIs
MTTR, MTBF, completion rates, and SLA compliance, all updating in real-time as work gets done.
- Live dashboard updates
- Trend indicators
- Drill-down capability
Historical Analysis
Compare performance across weeks, months, or years. Spot patterns and prove continuous improvement.
- Year-over-year trends
- Seasonality detection
- Improvement tracking
Cost Tracking
Know exactly where every maintenance dollar goes. Justify budgets with actual data.
- Cost per asset
- Labor vs parts split
- Budget forecasting
One platform, different views
Everyone sees what they need, from C-suite overviews to technician details
Facilities Manager
Operations Overview
Complete operational visibility. Track team performance, SLA compliance, and maintenance costs across all locations from one dashboard.
Operations Director
Strategic Insights
Executive-level reports with ROI metrics and cost analysis. Perfect for budget justification and strategic planning sessions.
Maintenance Supervisor
Team Management
Compare technician performance, identify training needs, and optimize workload distribution across your team.
Finance Team
Budget & Cost Control
Detailed cost breakdowns by category, vendor, and department. Budget variance tracking and forecasting tools.
Prove your team's value with real numbers
Stop guessing. Start measuring. Show leadership exactly what maintenance delivers.
Pre-built Dashboards
Start with proven templates for MTTR, MTBF, SLA compliance, and team utilization. No setup required.
MTTR & MTBF Tracking
Measure response time and equipment reliability automatically. Track trends and benchmark against industry standards.
Scheduled Reports
Auto-deliver reports to stakeholders on your schedule. Weekly summaries, monthly reviews, or custom intervals.
Export to Excel/PDF
One-click exports for board meetings, audits, and compliance documentation. Professional formatting included.
SLA Compliance
Track response times against service level agreements. Get alerts before breaches and prove compliance to clients.
Cost Analysis
See maintenance spend by asset, location, or team. Identify cost-saving opportunities and optimize your budget.
Analytics FAQ
Everything you need to know about Infodeck Analytics
Still have questions?
Ready to measure what matters?
Stop manually pulling reports. Let Infodeck show you the numbers that prove your team's impact.